As we model and analyze business processes seeking to improve them, we often look for common failure modes, circumstances where many instances of the process execution show a common problem. Pareto is our friend, and we hope to find just a few causes of many problems. Our focus is on problems and their causes. We focus on what normally happens and put aside the variations. We concentrate on the common and statistically significant, since that’s where we have the most information and understanding, and where we will find the major performance process improvement impacts. That all seems fairly logical doesn’t it? Yes it does, and sometimes it’s also the completely wrong approach; sometimes the focus on the significant and common occurrences blinds us to the powerful insights to be gained from the insignificant and the exceptional.
What if, as well as looking at problems and their causes, we also looked for opportunities and their constraints? What if, instead of dismissing the exceptions for lack of statistical significance, we embraced the exceptions because they are exceptional? If we look outside of the ‘normal middle’ of the performance curve, what can we learn from the outliers?
In his book of the same name, Malcolm Gladwell1 defines an outlier as “a statistical observation that is markedly different in value from the others in the sample.” He analyzes the circumstances in which people, and groups of people, achieved exceptional success, ie how they became outliers. Covering a very wide canvas – millionaires, communities and law firms to cultures, hockey stars and plane crashes – Gladwell shows that success has a context, and that this context can often be described, analyzed and replicated. From his many examples, he clearly demonstrates that exceptional performance is not an accidental occurrence, and if we study the outliers we can find the cause of the exceptional effect.
Gladwell focuses on successful people in his ‘outliers’ thesis. His premise, that success has a context and is not random, can also be applied to business process performance. If, in a particular circumstance, process performance is exceptional (positively or negatively), what can that tell us? Can we learn to avoid the negative and replicate the positive conditions? What arethe “vital behaviors” 2 that cause a process to work really well? (Patterson et al model the circumstances that have caused ‘outlier’ performance in difficult change management contexts.
Their work has important implications for business process change – but that’s a subject for another time). If we could isolate those success factors that create the rare exceptions, could we use them to improve performance across all instances?
What if we could take the bottom 20% of performers and make them even just average performers?
That could be a massive improvement.
The idea of Positive Deviance (+D) can be very effectively applied to business process performance improvement 3. The +D approach is a problem-solving approach for complex behavior and social change. In its original application mode, the approach enables communities to discover existing solutions to complex problems within the community 4
The term “Positive Deviance” was first used in relation to research into human nutrition in the 1990s where the existence of “Positive Deviant” children in poor communities who were better nourished than others was documented. Rather than focus on community-wide issues, the project focused on discovering and amplifying what was going right in relation to the particular children whose nutrition was significantly better than others. The insights gained from this approach were then used to radically improve nutrition across the community. Based on that seminal work, +D has been operationalized as a tool to promote behavior and social change and to organize various social change interventions around the world. Although the origin and main use of +D has been in resolving seemingly intractable social and community problems, the concepts can be applied to any environment where appropriate comparative performance data is available.
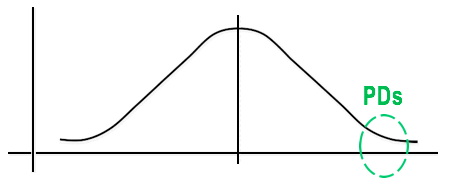
 In any distribution of performance outcomes, some data will exist at the extremes. These are the deviants, the results that show very different (positive or negative) outcomes to the mean. +D analysis focuses on the positive variants. It seeks to understand why performance in those cases is so much better and how that success might be translated across the population.
+D has been used with profound success to address a wide range of social and community issues including childhood malnutrition, neo-natal mortality, girl trafficking, school drop-out, antibiotic resistant bacteria infections and HIV/AIDS. The development and application of the approach is documented in The Power of Positive Deviance 5. It is not my intention here to replicate the contents of that book, nor do I mean to minimize the sophistication and complexity of the approach. I will draw some conclusions from the +D theory and practice below, but it’s an important book and process practitioners might usefully read it for themselves.
Note that in +D analyses we must have comparable and accurate data from a coherent set of examples. The population-in-focus needs to be closely associated, e.g. a set of offices in the same organization, a series of call centers run by the same company, dealerships for the same car brands across a territory, or outlets in the same retail chain. This is not a version of generic “best practice” or “industry benchmarking”. For +D to be effective, we must have unrestricted access to all performance data for the entities being examined, and the entities (the business processes) must be directly comparable.
In the business process context we can search for examples where a particular process is being executed extremely well, i.e. we look for the Positive Deviant (PD). PDs are examples of exceptional good performance and are the cases that we might otherwise dismiss as not being representative of what “normally happens” in the execution of the process.
This is not a simple matter of spotting the high end positive performance and “making the rest like that”. Spotting the high performers might be easy enough if the data is available, e.g. number of defects, amount of rework, sales volume etc, but establishing the causal effects will be much harder. What is it about the positive deviants that causes their success? Indeed, what do we really mean by “success”. For example, what if an application assessment process is consistently executed at a level of success (however that is defined) in one office that is consistently much higher than in any other office? Rather than dismiss this as an aberration, we might usefully search for the cause of the exceptional performance. There may be many variables that apparently correlate to success, but we need to discover those that are a direct cause. The exceptional performance might be due to personnel, location, facilities, training, customer demographics, local organizational culture, adherence to SOPs, technical understanding of policy, perceptions of empowerment, weather … or any number of variables. Which of these are causally linked to the high performance? What elements can be isolated in this special office and transferred to the others to raise the overall level of process performance and reduce the amount of deviation across the population. Inevitably, this requires complex statistical analysis and the inclusion of an experienced data scientist on the process improvement project team is necessary to properly identify the vital behaviors and circumstances that create the PD.
Using the +D ApproachAn outline of how a process improvement project might use the +D approach is presented below. In the right circumstances, it is a powerful tool, but don’t underestimate the degree of difficulty and the need for lots of appropriate data.
The main project activities are as follows:
- Determine how success is measured so as to understand the criteria by which PDs can be identified. This needs to be done with precision and clear
- Collect data to populate the PD identification criteria defined above. Make sure this is objective, measured data that will allow clear performance rankings to be
- Identify the PDs. Are there examples of exceptional performance identified in the data?
- Identify the factors that might be making the PDs exceptional. There may be many variables in
- Now is the time for hard core statistical analysis to define the factors with causal links to exceptional performance. This analysis determines the vital behaviors that create a
- Conduct controlled tests to prove the performance excellence hypotheses coming from the PD
- Communicate the PD practices across the population, e.g. videos, new policies, roadshows etc. This is a critical part of the change management
Avoiding Problems
Although it can be a very powerful tool, +D analysis is not as easy as it might seem at first glance. Some of the potential problems and related countermeasures, are presented:
Problem: Failure to identify the meaning of “success”
Countermeasures:
- extensive observation
- discussion with key stakeholders
- create an effective performance data set
Problem: Failure to identify the complete set of variables that might impact performance
Countermeasures
- extensive observation
- discussion with key stakeholders
- collect and collate all available data related to the success measures
- use a variety of discovery vectors: videos, interviews, documents, observations, mystery shopping, process walkthroughs, process mining
- apply discovery approaches across many instances of the process
- think laterally, looking for the ‘hidden’ factors
Problem: Failure to correctly identify the vital behaviors and circumstances which are the cause of the exceptional performance
Countermeasures
- include a skilled data scientist in the analysis team
- be guided by the data, not by common ideas of “best practice”
- ensure that causation is proven, not just correlation
- conduct controlled tests to prove the hypotheses
Problem: Failure to effect change to reflect the PD performance insights
Countermeasures
- communicate, communicate, communicate
- demonstrate, beyond doubt, to all stakeholders that the proposed changes are proven to be effective
- involve key stakeholders in the proof-of-concept tests so they can have a personal experience of the positive effects of changes
- monitor the effects of the changes and adjust if necessary
In Conclusion
Positive Deviance practices can help us discover the sorts of significant business process improvements that should be our goal. It’s too easy to be satisfied with mundane and incremental improvements. Occasionally, at least, the results of process improvement should be remarkable.
There is a lot to be gained by looking closely at the circumstances that give rise to process instances that are well outside the center of the normal performance distribution. Rather than reject rare examples of extraordinary performance as statistically insignificant aberrations, embrace the exceptional and seek to make it the new norm.
_______________
Gladwell, Malcolm. 2008. Outliers: The story of success. Little, Brown and Company.
Patterson, Kerry, Joseph Grenny, David Maxfield, Ron McMillan, and Al Switzler. 2008. Influencer: The power to change anything. New York: McGraw-Hill. pp 28.
I gratefully acknowledge Professor Michael Rosemann, and his team at the Queensland University of Technology, for the insight into the use of Positive Deviance analysis in process improvement. The BPM Group at QUT is itself an excellent example of a Positive Deviant in the analysis and innovation of the ‘process of process management’.
Further information at www.positivedeviance.org.
Pascale, Richard, Jerry Sternin, Monique Sternin. 2010. The Power of Positive Deviance: How unlikely innovators solve the world’s toughest problems. Boston: Harvard Business School Publishing.
This artcle was orginally posted on www.bptrends.com


